Call centers play a vital role in delivering exceptional customer experience and serve as an extension of a company’s business. It is crucial to measure and continuously improve call center performance to ensure customers receive the highest level of service.
In this article, we will dive into the world of call center metrics and KPIs. Discover what these metrics are and how they can be effectively utilized to enhance the overall customer experience.
Table of Content
- What are Call Center Metrics? →
- Why Track Call Center Metrics? →
- Key Call Center Metrics & KPIs to Monitor →
- Best Practices to Improve Overall Call Center Performance Metrics →
- How to Monitor & Track Call Center Metrics & KPI →

1. What are Call Center Metrics?
Call center metrics are key performance indicators (KPIs) used to track and measure the performance and efficiency of a call center. They provide valuable data to assess customer satisfaction, agent productivity, and overall operational effectiveness. Call Center managers should monitor these trends and patterns to gain a comprehensive understanding of their team’s performance and make the right decisions to increase customer satisfaction.
2. Why are Call Center Metrics Important?
Call centers provide a direct channel for customers to voice their opinions and shape perceptions of your brand. Analyzing call center or contact center metrics allows you to spot potential issues that may negatively impact customer satisfaction scores. By taking action based on insights gained from tracking metrics, you can foster loyalty and satisfaction, ultimately gaining more loyal customers.
Call center performance metrics can help you answer a few key questions:
- How easy is it for a customer to get in touch with you?
- How promptly and effectively are you addressing their concerns?
- How satisfied are they with their experience?
- Where can we make improvements?
Certain metrics are universally valuable and will undoubtedly highlight areas where the team can improve performance or productivity. Let’s explore them below.
3. Key Call Center Metrics and KPIs to Monitor
What exactly should call centers be monitoring and measuring? You can broadly map call center metrics into three groups:
- Agent performance metrics
- Customer experience metrics
- Call center operational metrics
| Agent Performance Metrics and KPIs | |
|---|---|
| 1. Average Handle Time (AHT) | 2. Average Hold Time (AHT) |
| 3. Average Talking Time (ATT) | 4. Calls Answered, Missed, and Abandoned |
| Customer Experience Metrics and KPIs | |
|---|---|
| 1. Net Promoter Score® (NPS®) | 2. Customer Satisfaction Score (CSAT) |
| 3. Customer Effort Score (CES) | 4. First contact resolution (FCR) |
| 5. First Response Time (FRT) | |
| Call Center Operational Metrics and KPIs | |
|---|---|
| 1. Service Level Rate (SLA) | 2. Cost Per Call (CPC) |
| 3. Active Waiting Calls | 4. Peak Hour Traffic |
| 5. Average Call Answer Rate | 6. Average Call Abandonment Rate |
| 7. Missed Calls Rate | 8. Max Waiting Time |
| 9. Average Waiting Time | 10. Callback Messaging |
Agent Performance Metrics and KPIs for Call Center
1. Average Handle Time (AHT)
Average Handle Time (AHT) refers to the average duration an agent spends on a customer interaction, starting from when they answer the call until it is disconnected. Typically, A higher AHT indicates higher costs and a potentially negative impact on the customer experience, so it’s often a big focus for call centers.
The formula is: (Total Ring Duration of Answered Calls + Total Talk Duration of Answered Calls) / Total Answered Calls
2. Average Hold Time (AHT)
Average Hold Time (AHT) measures the average duration that agents keep callers on hold during a customer call. Companies typically aim to minimize hold time in order to provide prompt customer service.
The formula is: Total Hold Duration / Total Answered Calls
3. Average Talking Time (ATT)
Average Talking Time (ATT) means the average amount of time that agents spent talking to callers. Unlike Average Hold Time, ATT does not include the time spent on hold. Optimizing the average talk time is essential to enhance efficiency and reduce unnecessary costs of call centers.
The formula is: Total Talking Time / Total Answered Calls
4. Calls Answered, Missed, and Abandoned
Calls Answered, Missed, and Abandoned are key metrics in measuring agent workload and performance. These count numbers, along with various rate statistics of per agent, offer valuable insights into agent efficiency, responsiveness, and customer satisfaction. Monitoring these metrics help managers decide how to allocate resources more effectively.
Yeastar P-Series Phone System Agent Performance Report
Customer Experience Metrics and KPIs for Call Centers

1. Net Promoter Score® (NPS®)
NPS measures customer loyalty and satisfaction with a single question: “On a scale from 1 to 10, with 1 being unlikely and 10 being likely, how likely are you to recommend this business to a friend?”
Responses are categorized into three groups: promoters (those who select 9 or 10), passives (those who select 7 or 8), and detractors (those who select 6 or below). The NPS is calculated by subtracting the percentage of detractors from the percentage of promoters. Similar to other customer experience metrics in call centers, a higher NPS indicates better performance.
2. Customer Satisfaction Score (CSAT)
Customer Satisfaction (CSAT) indicates how satisfied customers are with your products, services, or customer support. Typically assessed through customer satisfaction surveys, CSAT scores serve as a leading indicator of customer loyalty and long-term revenue potential.
Based on a predefined scoring system, responses are categorized into levels such as:
- Very Satisfied
- Satisfied
- Not Satisfied
- Very Unsatisfied
3. Customer Effort Score (CES)
The Customer Effort Score (CES) measures how much effort a customer had to exert to get an issue resolved by your customer support team. Similar to the Customer Satisfaction Score (CSAT), there is no standard measurement system for CES. Some companies use a five-point scale, while others prefer a seven-point scale.
Results are gathered based on a single question, such as:
“On a scale of one to seven (seven stands for Strongly Agree and one for Strongly Disagree), did the service make it easier for you to solve your problem?”
Higher CES scores indicate better customer experiences, suggesting that the service or product effectively helped the customer solve their issue with minimal effort.
4. First Response Time (FRT)
FRT (First Response Time) also known as “Average Waiting Time ” measures the average duration a customer waits before connecting with an agent. While the benchmark for a “good” FRT can differ across industries, generally, a lower FRT enhances customer satisfaction. Conversely, a high FRT may signal issues with staffing levels or technological capabilities.
The formula is: (Total Ring Duration + Retry Interval) / Total Calls
5. First contact resolution (FCR)
First Contact Resolution (FCR) is the number or percentage of tickets an agent resolves on their first attempt. FCR is a critical indicator of exceptional customer service and is often regarded as a foundational KPI in call centers.
Customers prefer to have their issues resolved on the first call, which significantly enhances satisfaction and reduces the likelihood of customer attrition. Tracking FCR helps you understand how effectively your customer support team is meeting customer expectations.
Call Center Operational Metrics and KPIs
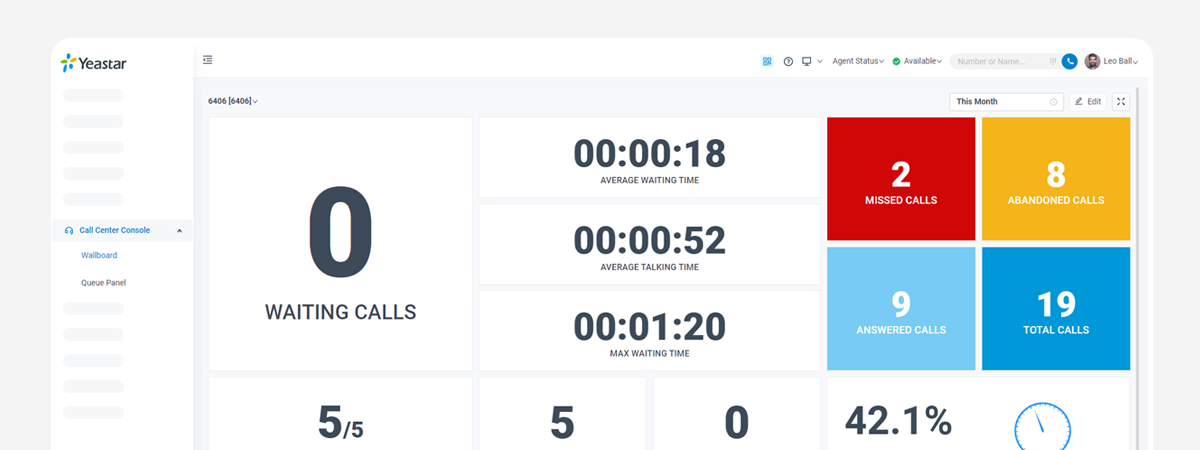
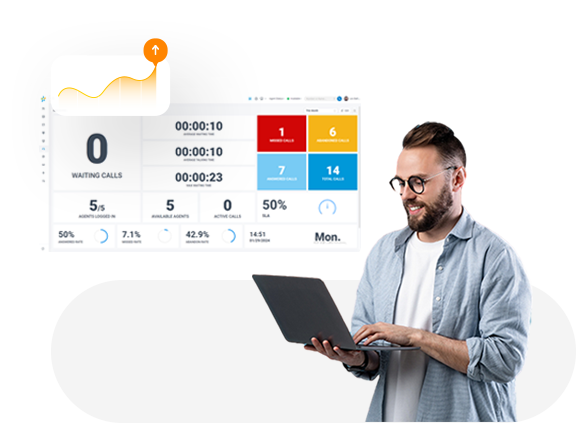
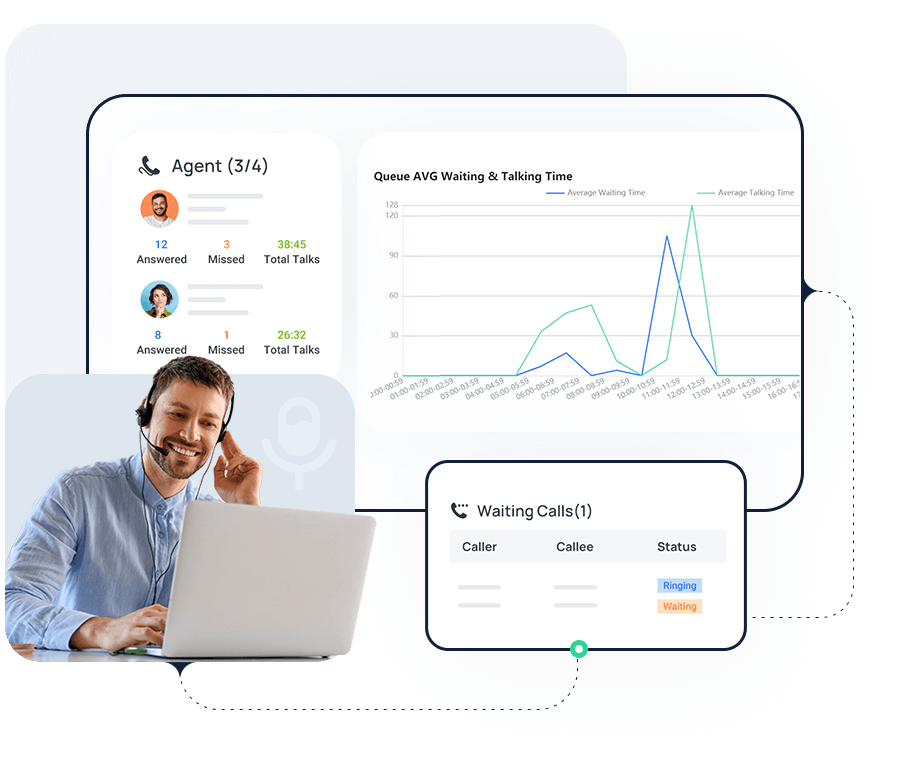
Yeastar P-Series Phone System Wallboard
1. Service Level Rate(SLA)
SLA refers to the percentage of conversations that are answered within a set timeframe. It is an important indicator of a call center’s performance and efficiency, measuring how well a call center can handle incoming calls while maintaining acceptable hold times.
The formula is: (The Number of Calls Answered within SLA Time) / Total Calls) * 100%
2. Cost Per Call (CPC)
CPC measures the average expense incurred for each call handled by a contact center agent. This metric provides valuable insights into the efficiency of your operations and informs resource allocation decisions. By assessing CPC, you can determine whether your call center is operating cost-effectively and managing its resources efficiently.
The formula is: Total Cost of All Calls / Total Number of Calls
3. Active Waiting Calls
Active Waiting Calls compares the current call volume to the number of callers waiting for agent assistance. This real-time metric provides valuable performance insights for agents and encourage them to efficiently resolve calls in a timely manner. It is noticeable that delivering quality customer service should never be compromised in the process.
4. Peak Hour Traffic
Identifying peak call volumes is crucial for ensuring that your business can adequately meet customer needs. The peak-hour traffic metric helps you anticipate when your call center will experience the highest call volumes, allowing you to optimize workforce engagement and accurately forecast staffing needs.
5. Average Call Answer Rate
Call Answer Rate shows the percentage of answered calls in relation to the total number of calls. A higher answer rate is indicative of better effectiveness for companies, as it implies fewer customers or callers being turned away.
The formula is: (Total Answered Calls / Total Calls) * 100%
6. Average Call Abandonment Rate
Call Abandonment Rate is a metric that calculates the percentage of inbound calls that terminates before the caller being connected to a live agent. Customers abandon the calls after long wait because they generally want their issues resolved quickly. Abandoned calls signal customer dissatisfaction and frustration.
The formula is: (Total Abandoned Calls / Total Calls) * 100%
7. Missed Calls Rate
Missed Calls Rate refers to the percentage of missed calls in relation to the total received calls. A higher missed calls rate may indicate a potential need for improvements in staffing levels, call routing, or overall call handling processes to minimize missed opportunities and enhance customer satisfaction.
8. Max Waiting Time
Max Waiting Time is the longest time a customer has to wait to be connected to a call center agent within a specific timeframe. It is important to reduce this metric as lengthy wait times can lead to customer dissatisfaction and negatively affect their overall experience.
The formula is: (Total Missed Calls / Total Calls) * 100%
9. Average Waiting Time
Average Waiting Time is a metric that measures the average amount of time a customer spends waiting for service or assistance. Long waiting times can lead to customer frustration and dissatisfaction. Generally, managers should always lower down waiting time to ensure customer satisfaction.
The formula is: (Total Ring Duration + Retry Interval) / Total Calls
10. Callback Messaging
Callback Messaging is a metric that measures the number of callers who choose to leave a message with their contact information for a call back, rather than waiting in a queue or being put on hold for an extended period. This allows agents to proactively reach out to customers. The goal is to keep this metric at a minimum as most customers prefer immediate issue resolution.
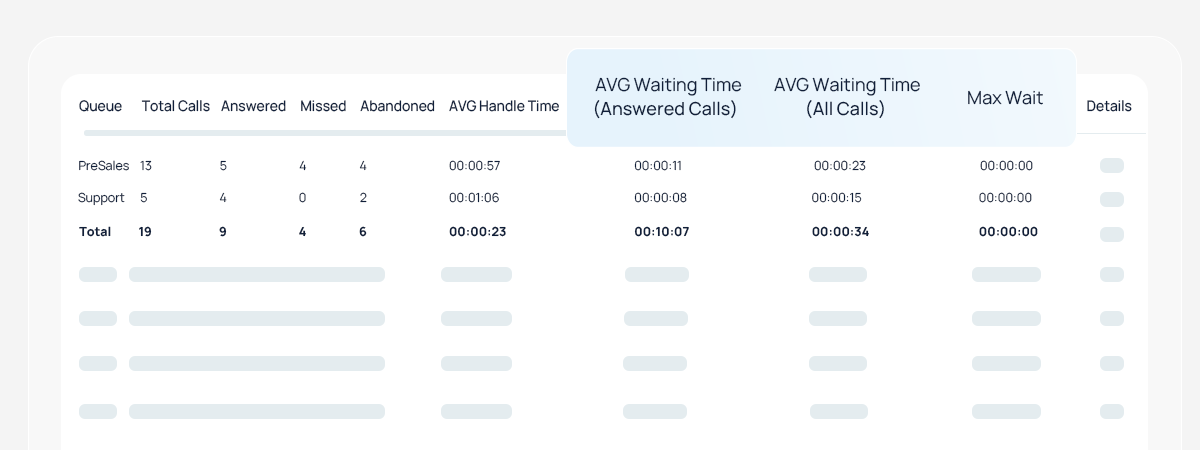
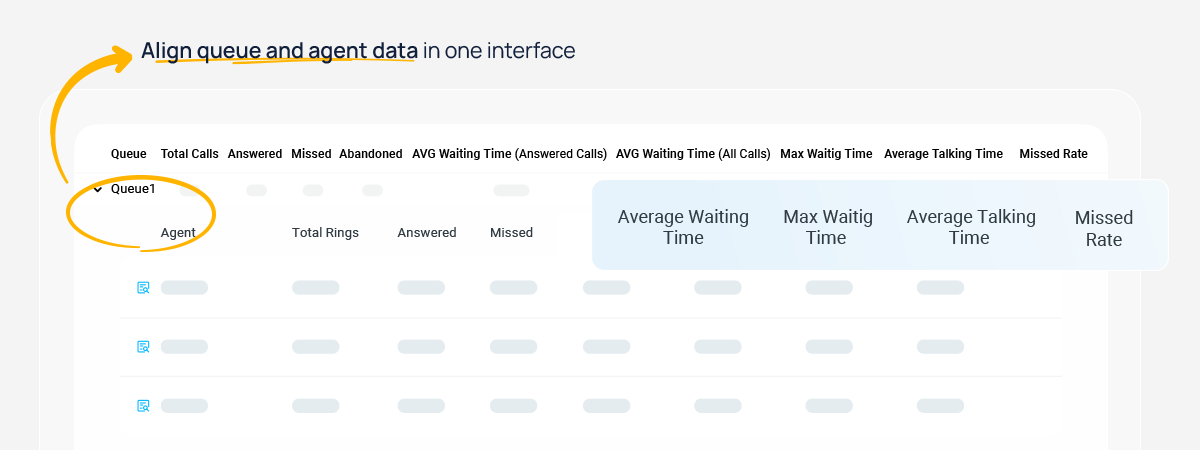
Yeastar P-Series Phone System Queue Performance Report
4. Best Practices to Improve Overall Call Center Performance Metrics
Monitoring metrics is an important first step in managing call centers efficiently, but true optimization comes from analyzing the data and using it to improve operations.
Empower Your Teams
Managers can receive comprehensive reports on agents’ performance and identify areas where improvement is needed to enhance the service ability of teams. Providing appropriate training for agents who need to enhance call handling skills is fundamental for call center improvement.
Set Specific Targets for Different Metrics
It’s vital to break down the goal of improving customer experience to be specific. You should establish clear and measurable targets for different call center metrics. For example, set a goal for a 90% first-call resolution rate within the next quarter, so that you can track progress more effectively.
Make Data Driven Decisions
By analyzing metrics, especially those that fall below industry standards or previous performance levels, you can identify the factors that may affect customer loyalty. This analysis enables you to implement informed changes in the right direction.
Track and Evaluate Progress Over Time
Due to the nature of call centers, it can be difficult to implement changes that quickly and directly impact your call center metrics, so it is vital to track and evaluate progress over time, assessing the effectiveness of implemented changes. Based on your observations, you can consider further improvements to optimize call center operations through an iterative approach.
5. How to Monitor & Track Call Center Metrics & KPI
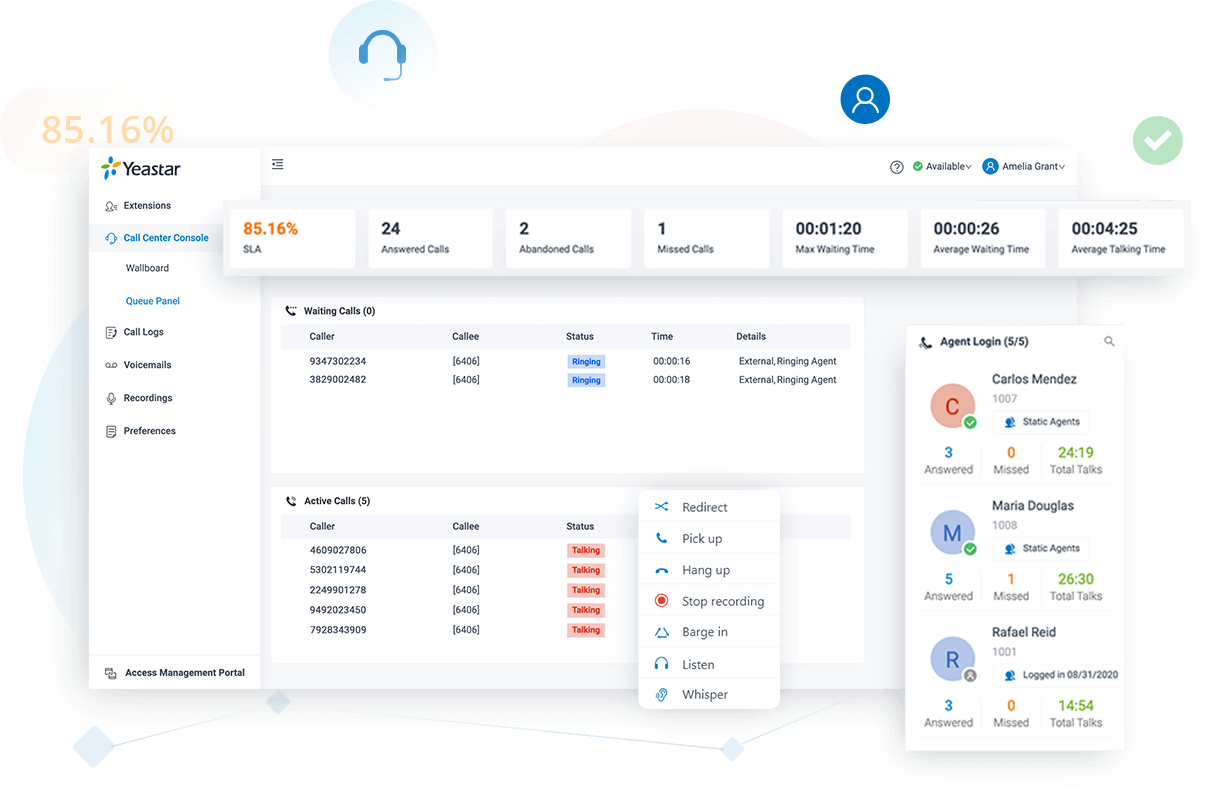
Yeastar P-Series Phone System, a call-center-capable solution, offers a comprehensive set of predefined call center reports that provide detailed insights into call center performance. Additionally, managers can easily monitor crucial metrics on Wallboard during daily operations.The reports are automatically generated in visually appealing graphs or charts, making analysis and data extraction effortless. You can get historical and real-time reports, allowing you to evaluate past activities and plan future actions as needed.
| Yeastar Call Center Reports | |
| Queue Performance Reports | Queue AVG Waiting & Talking Time |
| Queue Performance | |
| Queue Performance Activity | |
| Queue Callback Summary | |
| Queue Callback Activity | |
| Satisfaction Survey | |
| Satisfaction Survey Details | |
| Agent Performance Reports | Agent Login Activity |
| Agent Pause Activity | |
| Agent Missed Call Activity | |
| Agent Performance | |
| Agent Call Summary | |
Queue Performance Reports — Gain valuable insights into the work efficiency of one or more queues over time. These reports enable you to evaluate the performance of each queue accurately.
Agent Performance Reports — Analyze agent activities to gain insight into individual agent performance. These reports help you assess if agents meet the expectations of your call center over time.

Hey! I need some advice. Call me or text me on WhatsApp.
Hi, Julialew
What kind of advice are you looking for? Product or solution?
Hi, require assistance with a report one view, include the inbound received vs answered, what was missed, abandoned and summary of total calls received at agent level
Hi, Shereen
Could you describe it in more detail? For example, are you generating reports on the call center side?