What is PBX dashboard?
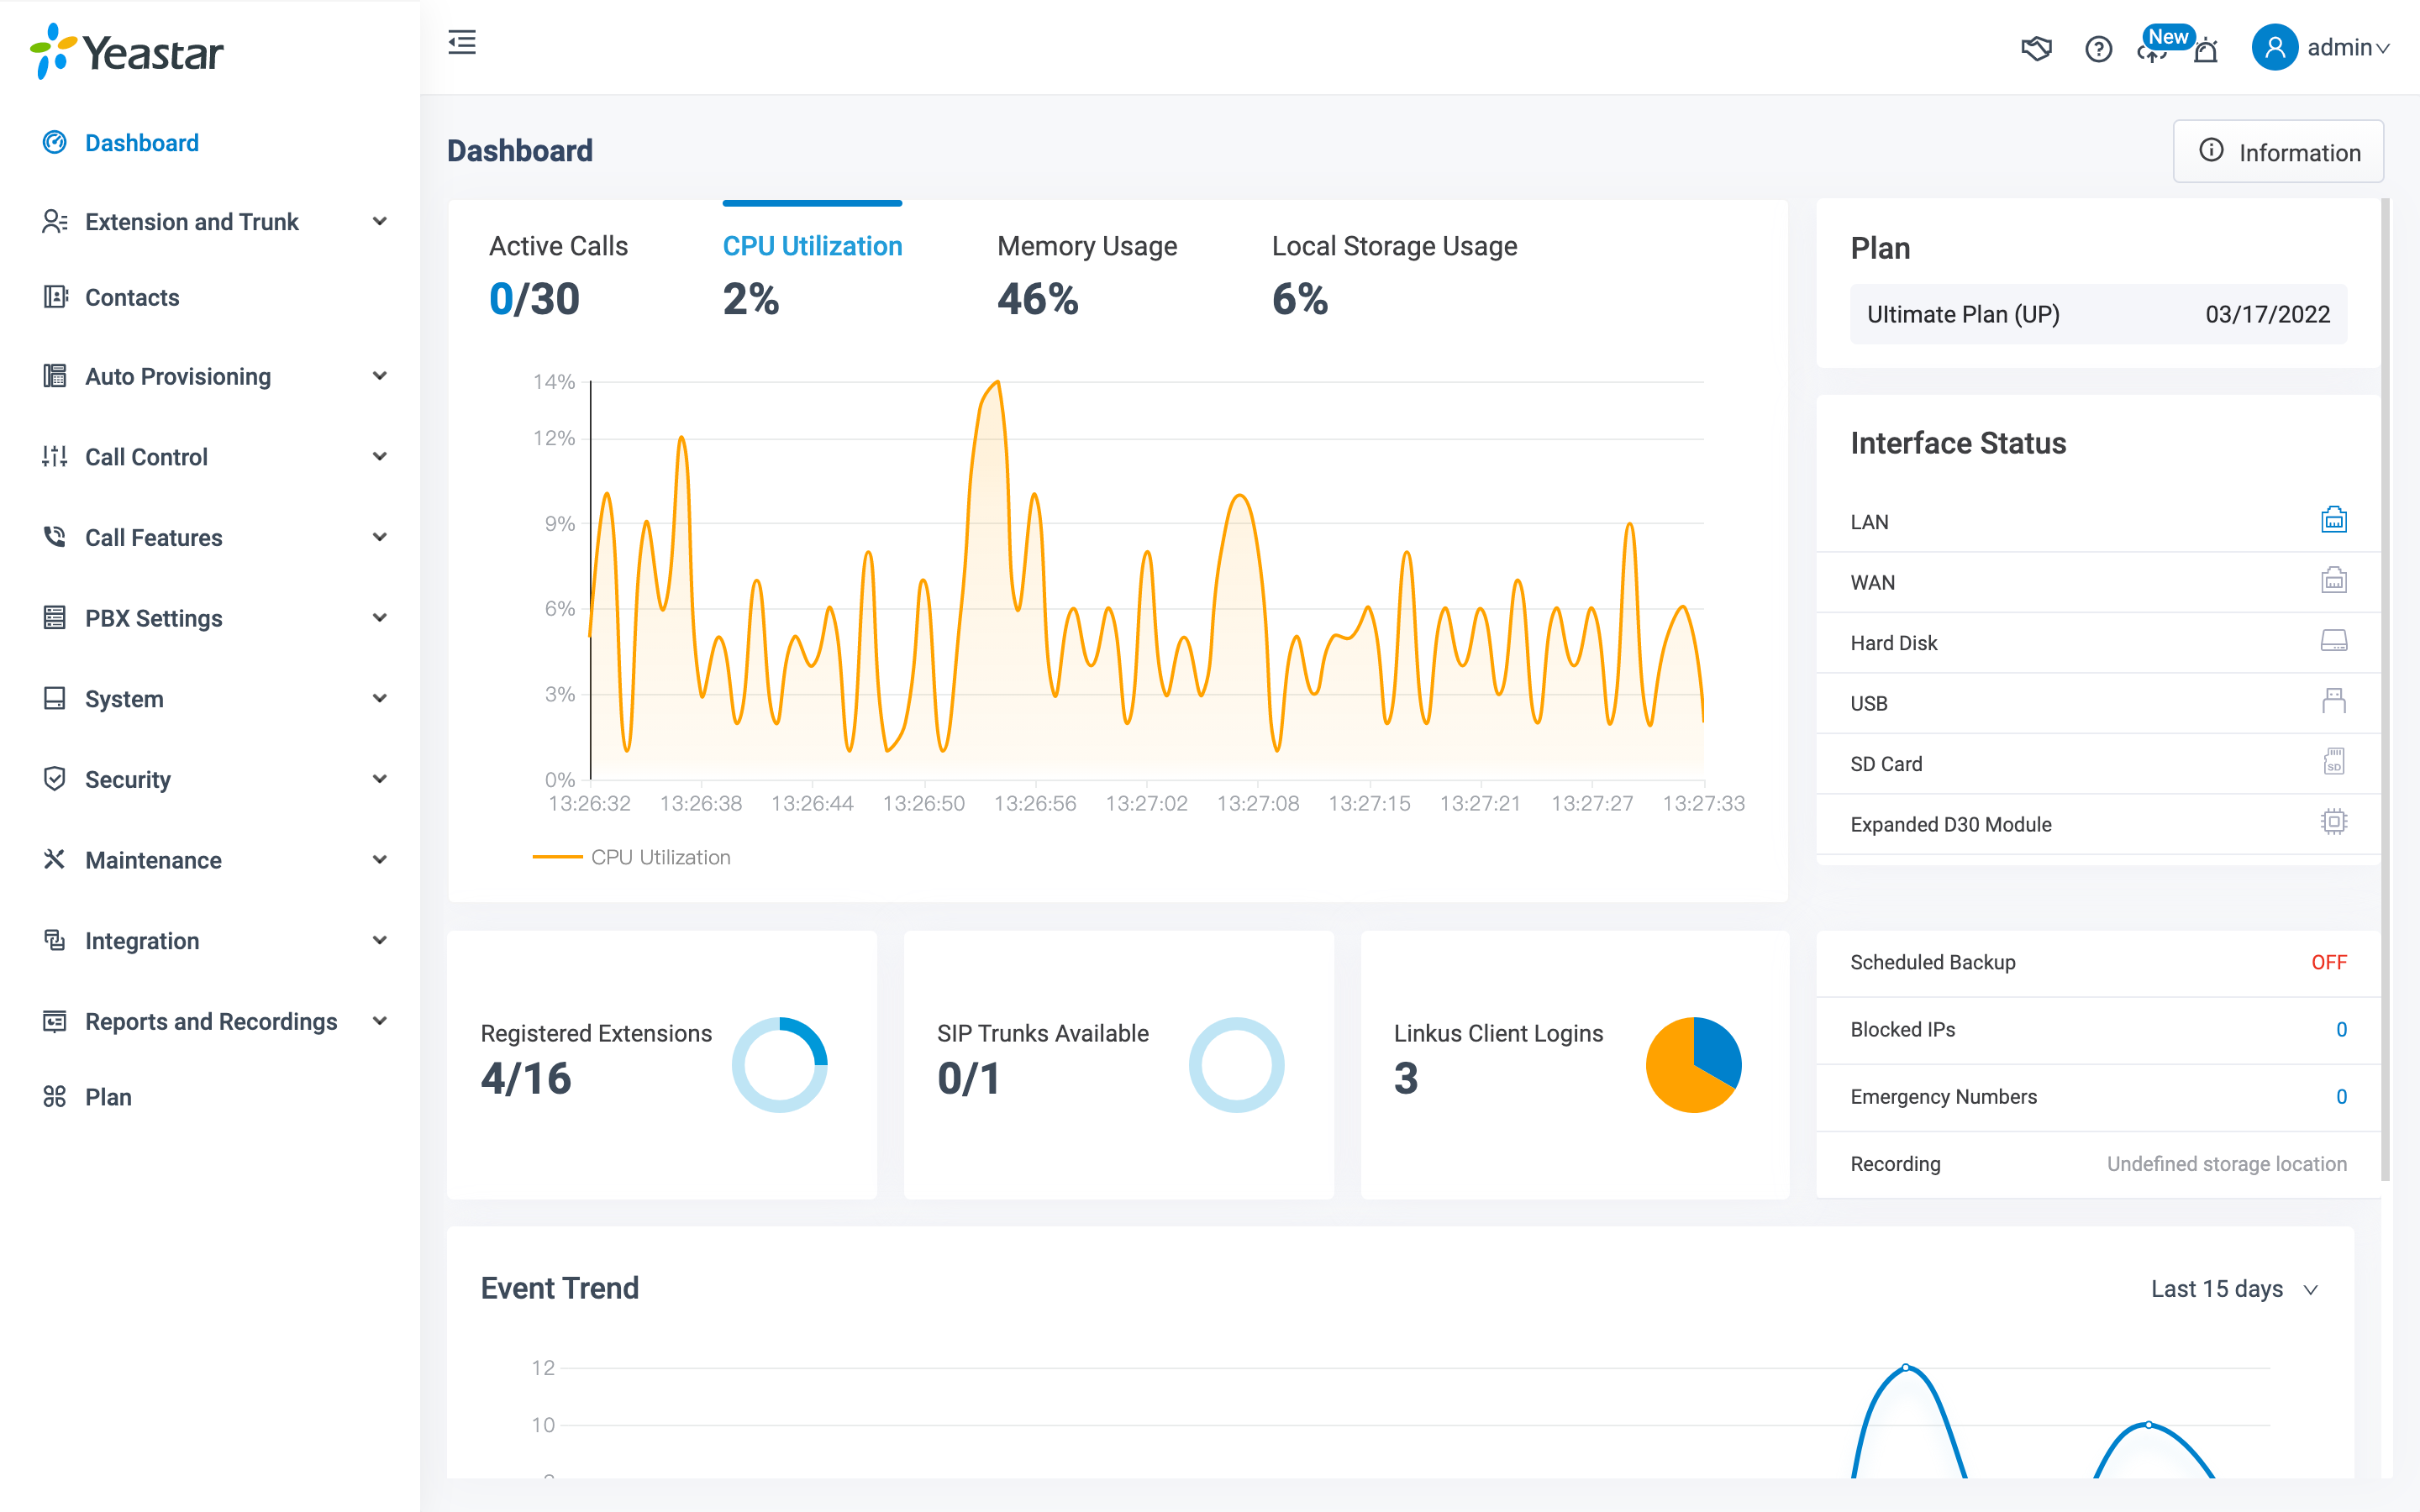
The Yeastar P-Series PBX dashboard offers a real-time overview of your phone system’s status, performance, and resource usage. It features intuitive charts that reflect current activities and display real-time counter values. With the dashboard, administrators can quickly monitor whether system extensions or trunks are working and registered correctly, and identify any issues that need immediate attention.
The dashboard updates and shows the following data in real time:
Number of active calls & upper limit
Number of active/registered trunks
Number of active/registered extensions
Number of online Linkus Desktop/Mobile/Web Client
Usage of system CPU/Memory/Storage
Status of telephony interface (for hardware PBX only)
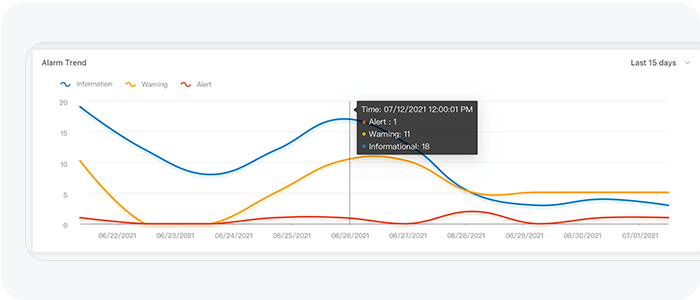
System event trends over the past 30 days (warning, alerts, information)
PBX basic info such as SN, system uptime, IP address, etc.
How to access details of an event/statistic on dashboard?
All data widgets and charts on the dashboard are clickable for admins to quickly access detailed information. For example, by clicking on a specific date on the Event Trend chart, the system automatically navigates to the event logs for that date, where admins can check event details.
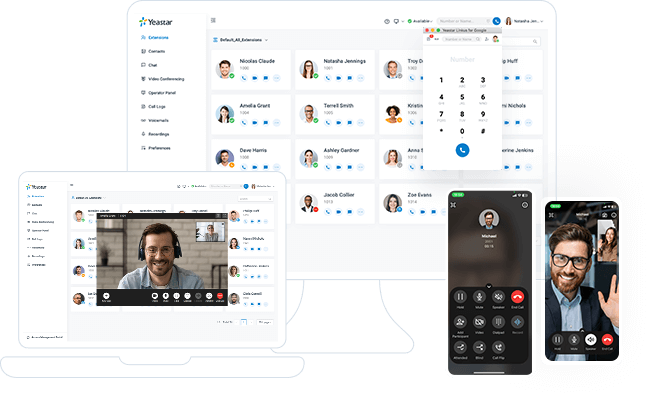
Complete Communications Solution
Available both in the cloud and on-premises, Yeastar P-Series Phone System unites calls, video, omnichannel messaging, integrations and more in one simple system for your seamless communications anywhere.
Get started with 30-day free trial
Create your Yeastar phone system in minutes & see what all-in-one communications can do for your business today.
X